Statistics is what turns your ISEF data from a picture into a claim. Judges do not need you to be a statistician — they need you to answer one question convincingly: how do you know your result is not just noise? That answer requires three things: a test chosen before you saw the data, a sample size you can justify, and uncertainty shown honestly on your board. Projects with all three survive interviews; projects without them stall at the second follow-up question.
Why data analysis is where interviews are won or lost
Walk a typical school science fair and you will see boards with beautiful bar charts and no error bars, conclusions drawn from three trials, and the word “proves” used freely. At the ISEF level, the judging pool includes working scientists and engineers, and their instinct when they see a difference between two bars is automatic: is that difference real? The official judging emphasis is on your research question, methodology, execution, and your own understanding of the work (see the current judging guidance on societyforscience.org for specifics) — and data analysis sits underneath all four. A student who can say “we pre-registered a two-sample t-test in our research plan, powered the experiment for eight replicates per condition, and the difference held at p < 0.01 with a large effect size” has just demonstrated methodology, execution, and understanding in one sentence.
This is also where authenticity shows. Judges probing whether the work is really yours rarely ask about your conclusion — they ask why you chose that test, what your null hypothesis was, and what would have changed your mind. We break down that questioning style in what ISEF judges look for at the booth.
The minimum statistical toolkit, by project type
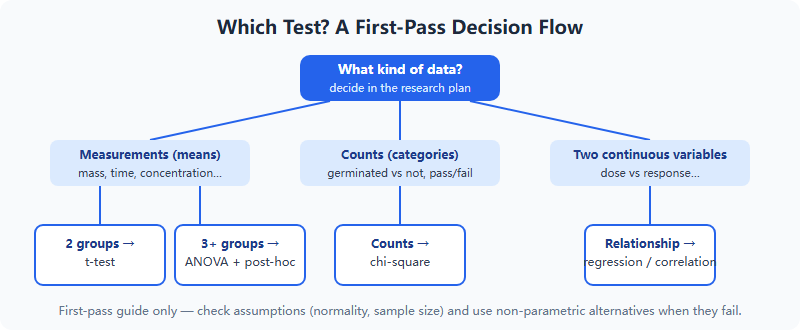
You do not need graduate statistics. Most successful high-school projects rely on a small set of tools, matched correctly to the data. The matching is the skill:
| Your situation | Typical tool | What it tells you | Classic mistake |
|---|---|---|---|
| Comparing a measured value between 2 groups | Two-sample t-test | Whether the difference in means is unlikely under chance | Using it on tiny samples with wild variance and trusting the p-value blindly |
| Comparing 3+ groups (e.g., 4 fertilizer doses) | ANOVA, then post-hoc comparisons | Whether any group differs; then which ones | Running many pairwise t-tests and inflating false positives |
| Counting categories (germinated vs not, pass vs fail) | Chi-square test | Whether category frequencies differ from expectation | Applying mean-based tests to count data |
| Testing a relationship between two continuous variables | Correlation / linear regression | Strength and direction of association | Declaring causation from correlation |
| Engineering / CS benchmark comparisons | Repeated runs + mean, spread, and appropriate comparison test | Whether your design beats the baseline beyond run-to-run noise | Reporting a single best run as “the result” |
Two notes of honesty. First, if your data badly violate a test’s assumptions (heavily skewed, tiny n), simpler non-parametric alternatives exist — and saying “we used a Mann-Whitney test because our data were not normally distributed” is exactly the kind of sentence that marks a student who understands their analysis. Second, the right time to pick your test is in the research plan, before data collection. Pre-committing is what separates hypothesis testing from fishing, and it starts with a question sharp enough to analyze — if yours is not, revisit how to choose an ISEF research topic that can actually win.
Sample size: the n=3 problem
The single most common statistical weakness we see in student projects is sample size chosen by convenience: three plants per condition, five trials per design, one benchmark run per model. Small samples have two costs. Statistically, they leave you underpowered — a real effect can easily fail to reach significance, and a spurious one can sneak through. Rhetorically, they hand the judge an easy question you cannot answer: “why three?”
You do not need a formal power analysis to do dramatically better than the average competitor:
- Run a pilot. A small pilot tells you how variable your system is. High variance means you need more replicates — and documenting that reasoning in your notebook is itself impressive.
- Budget replication into the timeline. Replicates cost weeks. This is a scheduling decision made months before the fair, not a statistical afterthought.
- Repeat the whole experiment, not just the measurement. Measuring the same three plants ten times gives you ten measurements of three plants — pseudo-replication that judges recognize instantly.
- For CS/engineering: repeat runs with different seeds or conditions and report the distribution, not the best case.
Showing uncertainty on the board — honestly
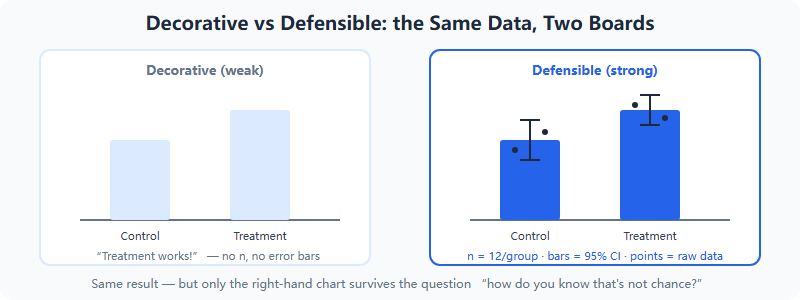
Your board is where analysis becomes visible, and the difference between a defensible chart and a decorative one is small in effort, large in effect:
- Error bars on every summary chart, with a caption stating what they are (standard deviation, standard error, or a confidence interval — these are different things, and you should know which you plotted).
- n stated on the chart. “n = 12 per condition” in the corner pre-answers the judge’s first question.
- Effect size alongside the p-value. “Statistically significant” and “practically meaningful” are separate claims; strong projects address both.
- Measured language. “Our data support…” and “consistent with…” instead of “proves.” Overclaiming is the fastest credibility leak in an interview.
- Show the raw spread where possible. A scatter of individual points over the bars demonstrates you have nothing to hide.
Five statistical mistakes judges catch immediately
- P-hacking by another name. Trying several tests and reporting the one that reached significance. The fix: pre-commit in the research plan.
- “Proves” from a single experiment. One study supports; it does not prove.
- Dropped outliers without a rule. Removing inconvenient points is data manipulation unless you set an exclusion criterion in advance and document it.
- Percent improvement with no baseline spread. “23% better” is meaningless if run-to-run noise is 30%.
- Misread p-values. p = 0.04 does not mean “96% chance my hypothesis is true.” If you quote a p-value, be ready to state what it actually is: the probability of data at least this extreme if the null hypothesis were true.
None of these require advanced coursework to avoid — they require deciding your analysis early and recording it. That, more than raw statistical firepower, is what distinguishes projects that advance along every path to the ISEF finals.
Where a coach fits — and where you must not outsource
Embark’s position is blunt: a mentor may teach you statistics; a mentor must never be your statistics. In practice, our discipline mentors — drawn from a network Embark reports at 3,000+ signed researchers (per Embark) — help students at three moments: choosing and pre-registering the right test at the research-plan stage, running a pilot-data review to sanity-check variance and sample size mid-project, and rehearsing the “defend your analysis” interview questions before fair season. The analysis itself is run, understood, and owned by the student, because at the booth you stand alone. That is the research-school model: coached to compete, not carried.
FAQ
Do ISEF judges expect formal statistics from every project?
Expectations vary by category and project, but every quantitative project should justify its conclusions against chance. Even a clearly explained t-test with honest error bars puts you ahead of most boards.
Is a significant p-value enough to win?
No. Judges weigh the whole chain — question, design, execution, understanding. A p-value from a flawed design impresses no one; see the current judging guidance on societyforscience.org.
What sample size do I need?
There is no universal number. Run a pilot, see your system's variance, and choose replication you can defend. “We chose n after piloting” is a strong interview answer.
What software should I use?
Whatever you genuinely understand — spreadsheet functions, Python, or R all work. Judges probe understanding, not tooling; never present output you cannot explain.
Work with Embark
The right statistical design is set months before the fair — at the research-plan stage. If you want a discipline mentor to pressure-test your analysis plan and rehearse the questions judges will ask about it, start the conversation early.
Embark is an independent research-coaching organization and the international competition team of Youfang Education. Embark is not affiliated with, endorsed by, or sponsored by the Society for Science or Regeneron ISEF. Results cited reflect Embark’s own published record (per Embark). Judging criteria and competition rules change — always confirm details on societyforscience.org. If you spot an error in this article, we correct verified issues within 7 working days.